

North was more efficient with the ball going against the wind, both by foot and in overall efficiency.
| Against the wind | Kicking efficiency % | Overall efficiency % |
| North Melbourne | 60.2 | 65.1 |
| Port Adelaide | 52.2 | 62.3 |
| Difference | +8% | +2.8% |
In last week's Scouting Report, Port Adelaide's time in possession was highlighted. It averaged 44 per cent in this area going into Saturday.
As the table shows, North was able to control the tempo of the game, taking away one of the Power's main advantages from their first five wins.
| Time in possession % | Port Adelaide |
| Rounds 1-5 | 44 |
| Round 6 | 36.1 |
| Difference | -7.9% |
North did its damage on the scoreboard from distance at Blundstone. Going into the match, more than half of Port's goals conceded were from within 30 metres.
However, North had just five goals in that range, with nine coming from further than 30 metres.
| Scoring distance | Less than 15 metres | 15-30 metres | 31-40 metres | 41-50 metres | More than 50 metres |
| North Melbourne (goals, behinds) | 2.0 | 3.1 | 4.1 | 4.3 | 1.3 |
North’s accuracy in front of goal was no coincidence. The Kangaroos got themselves in the best positions to score.
Looking at the score chart, 10 of their 14 goals came from the area termed as 'the corridor'.
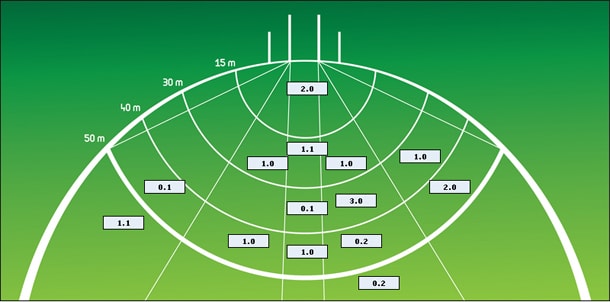 |
Taking a step back, the scoring shots were initiated from the midfield on the majority of occasions. North was well above league average in score launches from the centre.
| Midfield | Score launches % |
| North Melbourne | 82.6 |
| League average (Round 6) | 65.9 |
| Difference | +16.7% |
